Bayesian Model Example
Problem Statement
Use the Naïve Bayes approach to estimate the values for the missing cyl values (last 2 rows).
How to perform analysis
Step 1: Open Sigma Magic
- Click on the Sigma Magic button on the Excel toolbar.
- Click on the New button to create a new project.
Step 2: Add the analysis template
- Click on the Tool Wizard to add the analysis template.
- Click on Analytics and then Bayesian Models.
Step 3: Specify analysis options
A new worksheet will be added to your workbook. will be automatically opened, in the setup tab specify the survey results. 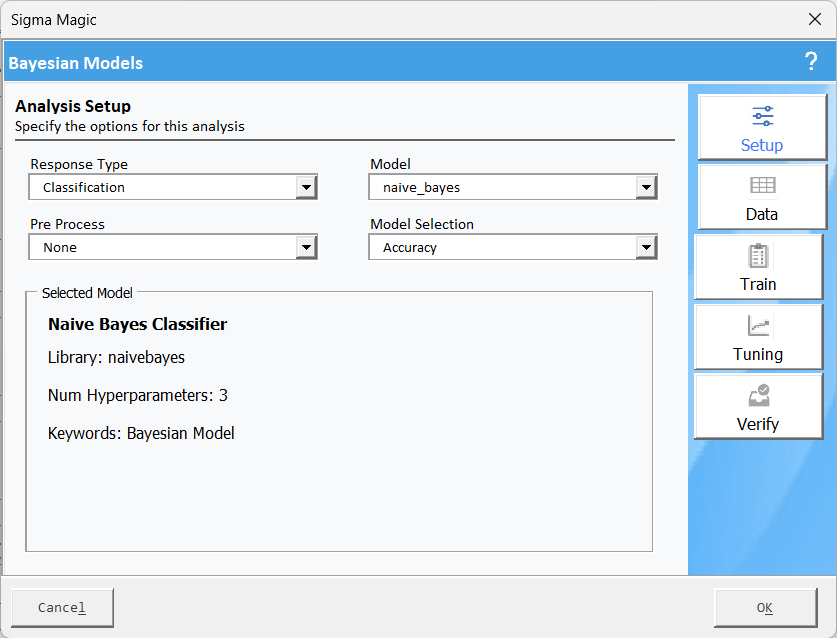
Click on Data to specify the data required for this analysis.
Click on the Train the software will let you pick the options for training the
given model. Training is a step where we split the data into groups a train data set and a test data set. 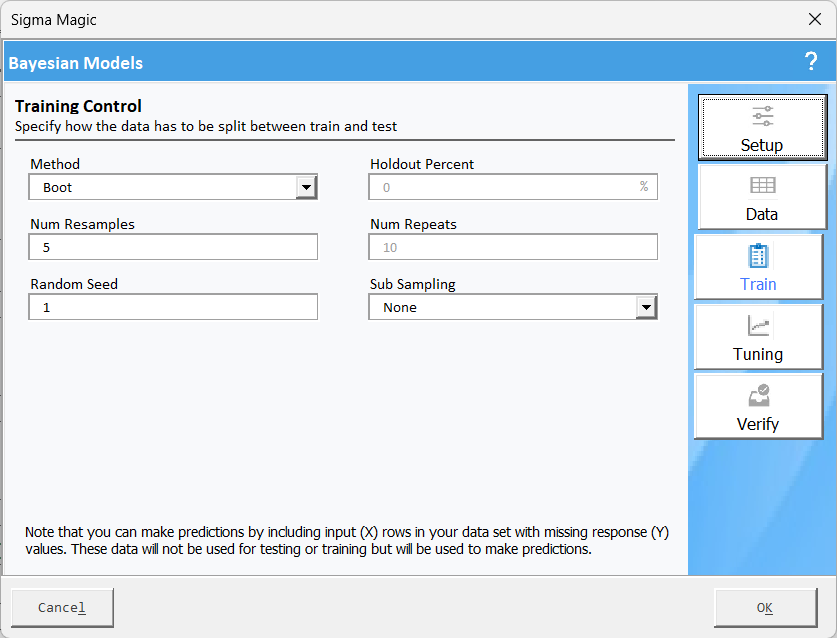
Click on the Tuning to
identifying the best set of hyperparameters that gives the best fit for the
given model. 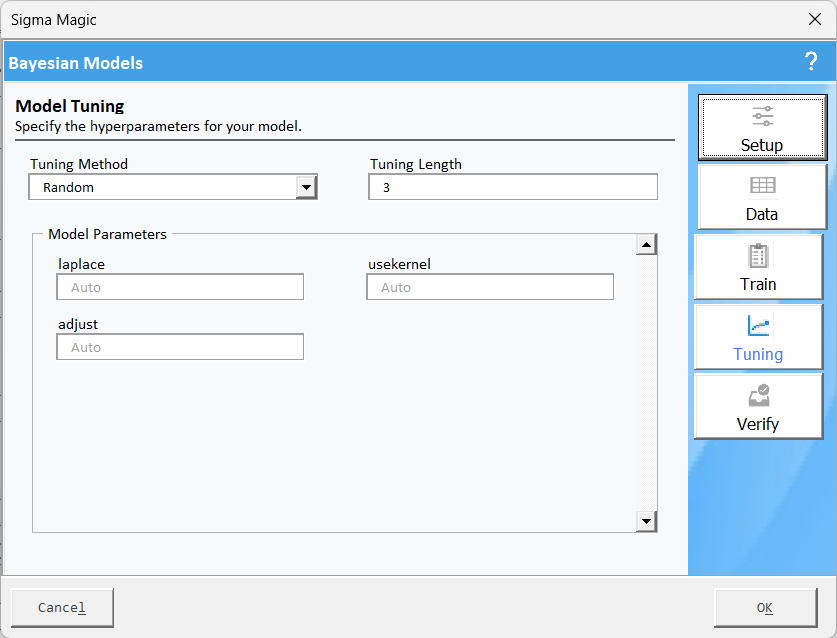
Click the Verify tab to ensure all the inputs are okay and shown in a green checkmark.
Step 4: Generate analysis result
Click OK and then click Compute Outputs to get the final results.
Interpretation of Results
- The Naïve Bayes Classifier achieved an accuracy of 80.08%, indicating a reasonably good classification performance.
- Accuracy represents the proportion of correctly classified instances, suggesting that The hyperparameter tuning optimization graph shows the variation of performance with respect to a selected tuning parameter.
- The 'laplace' parameter was fixed at 0, meaning no smoothing was applied.
- The 'adjust' parameter was also fixed at 0, keeping the default setting.
- The model used a classification approach with three distinct target classes ('4', '6', '8'), which likely represent the number of cylinders in an automobile dataset.
- Features include displacement (disp), horsepower (hp), rear axle ratio (drat), quarter-mile time (qsec), and carburetor count (carb).
- The dataset had 30 training rows (with 5 missing values) and 22 prediction rows.
- The table on the right presents the model's predictions for various input feature values.
- The predictions indicate that the classifier assigns cylinder values (Y) based on input features.
- The model is likely assigning classes based on probabilities calculated using Bayes' theorem.
- The variable importance plot indicates which features have the most impact on classification.
- Based on the provided visualization, variables like horsepower (hp), displacement (disp), and quarter-mile time (qsec) seem to be highly influential in predicting the class.
- Kappa score measures model agreement with true values beyond chance.
- The
Kappa values (0.665 & 0.618) suggest moderate-to-strong agreement,
reinforcing the model's reliability.
- Bootstrap resampling (5 reps) was used, ensuring robustness in accuracy estimation.
Related Articles
Bayesian Models Overview
Bayesian models are a class of statistical models based on Bayesian probability, which provides a probabilistic framework for updating beliefs based on new evidence. These models use Bayes' theorem to update prior knowledge with observed data to ...Bayesian model frequently asked questions
What is a Bayesian model? Sigma Magic's Bayesian model is a classification tool based on Bayes' theorem. It calculates the probability of an event occurring based on prior knowledge and evidence from data. What types of Bayesian models are available? ...Model Selection Example
Problem Statement Use the multiple models to predict the values for gear based on the other variables. The data for the exercise is shown in the Data tab. How to perform analysis Step 1: Open Sigma Magic Click on the Sigma Magic button on the Excel ...Boosted Model Example
Problem Statement Use the XGBoost model to predict the values for gear based on the other variables. The data for the exercise is shown in the Data tab. How to perform analysis Step 1: Open Sigma Magic Click on the Sigma Magic button on the Excel ...Coaching Model Example
Problem Statement Use the coaching model to coach a person on one issue. Pick a coachee who has an issue he/she wants to work with and use this form to help coach this person on the issue they are facing. How to perform analysis Step 1: Open Sigma ...