Correspondence Analysis Example
Problem Statement
We have collected data on several people's eye and hair color. Use correspondence analysis to determine if there is any correspondence between the two.
How to perform analysis
Step 1: Open Sigma Magic
- Click on the Sigma Magic button on the Excel toolbar.
- Click on the New button to create a new project.
Step 2: Add the analysis template
- Click on the Tool Wizard to add the analysis template.
- Click on Analytics and then Correspondence Analysis.
Step 3: Specify analysis options
A new worksheet will be added to your workbook. will be automatically opened, in the setup tab specify the survey results. 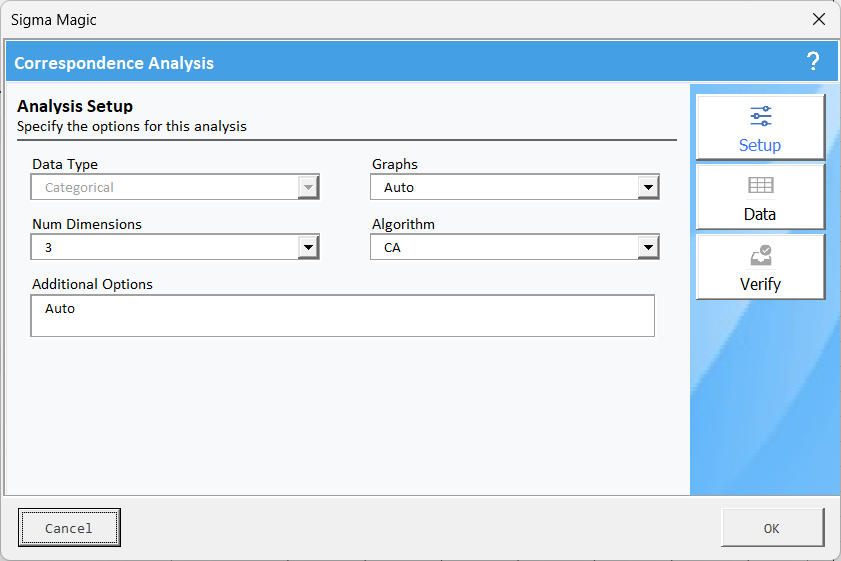
Click on Data to specify the data required for this analysis. 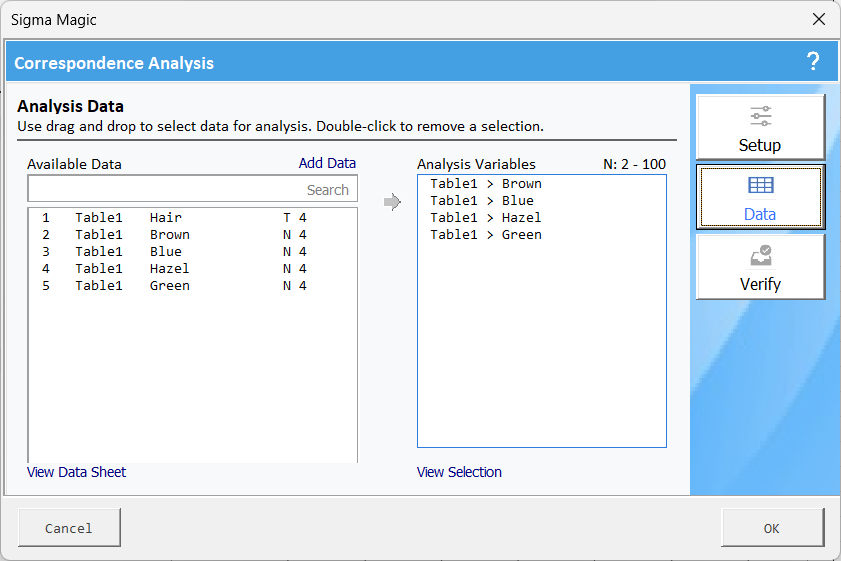
Click the Verify tab to ensure all the inputs are okay and shown in a green checkmark. 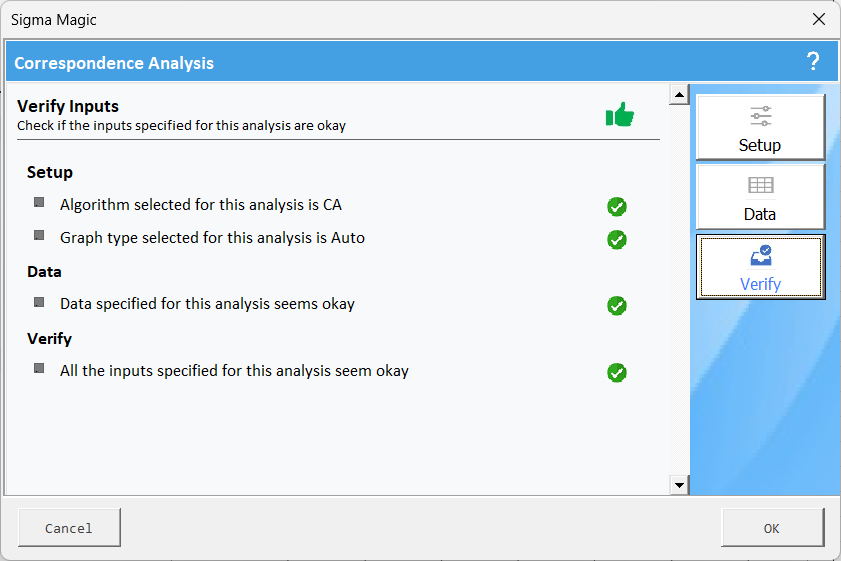
Step 4: Generate analysis result
Click OK and then click Compute Outputs to get the final results.
Interpretation of Results
- The analysis is based on categorical data with four variables (Brown, Blue, Hazel, Green).
- Three dimensions are extracted, reducing the data to a lower-dimensional space for visualization.
- The first dimension explains 89.4% of the variance, indicating it captures most of the associations in the data.
- The second dimension accounts for 9.5%, bringing the cumulative variance explained to 98.9%, meaning most information is retained within these two dimensions.
- The third dimension contributes only 1.1%, making it less significant for interpretation.
- The x-axis (Dimension 1) is the most influential in distinguishing categories, as it holds nearly 90% of the information.
- The y-axis (Dimension 2) provides additional, but minor, variation.
- Brown, Blue, Hazel, and Green are plotted, with their positions showing relative similarities or differences.
- Categories that are closer in the plot are more associated, while those farther apart have weaker relationships.
- For example, Hazel and Brown appear relatively close, suggesting they share similar response patterns, while Green and Blue are more distinct.
- The graph is symmetric, meaning the positions of the points are adjusted to ensure an optimal visual representation of associations between rows and columns.
- The placement of points helps interpret underlying relationships between the analyzed categories.
- The
first two dimensions effectively summarize the categorical relationships.
- Key insights can be derived based on category positioning—closely clustered categories share similar attributes, while those farther apart indicate distinct patterns.
Related Articles
Correspondence Analysis Overview
Correspondence Analysis (CA) is a multivariate statistical technique used to analyze categorical data presented in contingency tables. It helps visualize relationships between rows and columns by transforming the data into a low-dimensional space, ...Correspondence analysis frequently asked questions
What is Correspondence Analysis? Correspondence Analysis is a statistical technique used to analyze categorical data by identifying relationships between rows and columns in a contingency table. It helps visualize these associations in a ...SMED Analysis Example
Problem Statement Create a SMED analysis for reducing the changeover time for planes between two flights. # Description 1 Check if all personnel are present 2 Security check 3 Gather all tools & supplies 4 Cleanup plane 5 Refurbish plane 6 Clean ...Waste Analysis Example
Problem Statement Select a process and create the waste analysis for each step in the process. How to perform Analysis Step 1: Open Sigma Magic Click on the Sigma Magic button on the Excel toolbar. Click on the New button to create a new project. ...PEST Analysis Example
Problem Statement Create a PEST model for one of the products that is launched by your company. Investigate all the opportunities and threats for this product using the PEST model. How to perform analysis Step 1: Open Sigma Magic Click on the Sigma ...